The Predictor’s Forecast vs. The Superintendent’s Call: Why They Conflict & How to Use Both
Staring at an 85% snow day prediction while your district’s website remains silent? Understanding the fundamental clash between the predictor’s forecast and the superintendent’s call is key to alleviating anxiety and making informed plans.
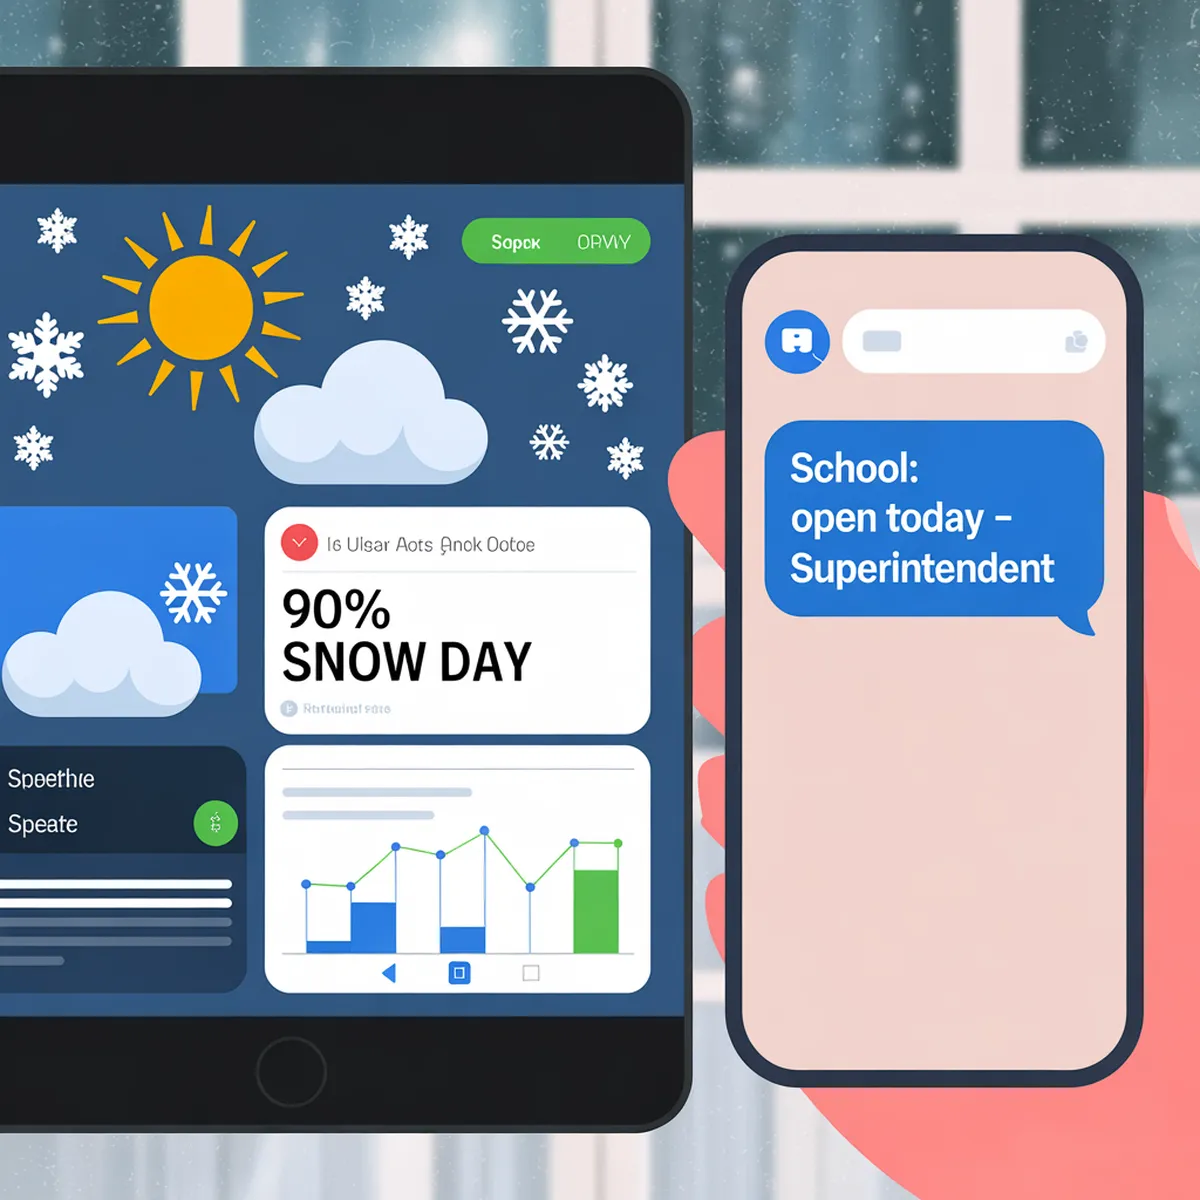
It is 5:15 AM. The coffee hasn’t kicked in yet, but the adrenaline certainly has. Outside, the world is white and quiet. Inside, your kitchen is a command center. On your phone, a popular snow day calculator app is flashing a confident 90% Chance of Closure. But on your laptop, the district homepage hasn’t updated since yesterday afternoon.
This specific form of winter purgatory is familiar to parents, teachers, and students everywhere. The frustration isn’t just about the weather; it is about two different systems speaking entirely different languages. One is offering you a statistical probability based on history; the other is making a high-stakes safety decision based on real-time liability.
As a former data analyst who has worked closely with school administration logistics, I have seen this tension from both sides of the screen. This guide will decode both systems, the algorithmic predictor’s forecast and the human-centric superintendent’s call, so you can interpret both like a pro and reduce your winter stress.
How a Snow Day Predictor Actually Works: It’s Not Magic, It’s Math
When you see a prediction app claim an 80% chance of a snow day, it feels like a promise. In reality, it is a calculation of probability based on a complex data diet. Understanding how these algorithms function helps manage expectations when reality doesn’t match the percentage.
The Data Diet
A snow day algorithm doesn’t just look at the weather channel. It ingests a massive amount of specific data points. First, it retrieves raw weather data from major meteorological models, such as the GFS (Global Forecast System) or the ECMWF (European Centre for Medium-Range Weather Forecasts). It looks at accumulation, timing, temperature, and wind speed.
But the real magic happens when it combines weather data with historical district-specific closure data. The algorithm “learns” your specific school district’s personality. It knows that District A stays open through six inches of snow because it is a rural district with plows, while District B closes for a dusting because they rely on steep, untreated city hills.
The Process and the Goal
Think of the algorithm like a doctor diagnosing a patient. The doctor (the algorithm) looks at current symptoms (the weather forecast) and checks the patient’s medical history (past closure decisions). Based on those two factors, the doctor offers a diagnosis: There is a high likelihood this is a snow day.
Crucially, the goal of the predictor’s forecast is not to predict the weather itself. Its goal is to predict human behavior. It is calculating the odds that your specific superintendent will look at the same weather data and decide to close.
Beyond the Data: The Human Factors of the Official Closure Decision
While the algorithm is crunching numbers in the cloud, the school superintendent is likely in a truck, driving down a back road at 4:00 AM. The official school superintendent decision process is far more visceral, legal, and high-stakes than any app can simulate.
The Timeline of a Call
The decision-making process usually starts the night before with a briefing from local emergency management. If the storm is ambiguous, the real work begins early.
- 3:00 AM: The superintendent and transportation director are awake, monitoring radar.
- 4:00 AM: They are physically driving the roads. They aren’t checking the highways; they are checking the “worst-case scenario” routes—the steep hills, the unpaved rural roads, and the narrow neighborhood streets where buses can easily slide.
- 5:00 AM: A conference call happens with neighboring districts and the transportation team.
- 5:30 AM: The decision is made. It has to be early enough to stop buses before they leave the depot and to catch parents before they leave for work.
Factors Beyond Weather
Algorithms struggle to account for the physical realities on the ground. A superintendent has to consider bus route safety across the entire district, not just the main roads. They have to worry about liability and safety protocols—if a bus slides off the road, that is on them.
They also consider campus conditions. Are the walkways salted? Is the heating working in the older buildings? What about the faculty commute? If teachers live in a neighboring county that is hit harder by the storm, the school can’t open safely due to staffing shortages, even if the local roads are clear.
The Burden of the Binary
The predictor gives you a percentage, which is a comfortable gray area. The superintendent must provide a binary answer: Open or Closed. (Or the dreaded Delay).
Often, a Delay or Hybrid decision is harder than a full closure. A two-hour delay buys time for sunlight and plows, but it disrupts parents’ work schedules and creates logistical chaos for bus drivers. The human weight of these decisions is something no algorithm currently factors in.
Predictor vs. Superintendent: A Side-by-Side Comparison of Goals and Limits
Why do they conflict? Because they are solving different problems. The predictor is trying to be right about the odds. The superintendent is trying to be right about safety.
Here is a breakdown of how the predictor’s forecast vs. the superintendent’s call compares:
| Aspect | The Predictor’s Forecast | The Superintendent’s Call |
| Primary Goal | Provide an early statistical probability | Ensure real-time, legal safety |
| Key Input | Historical data & forecast models | Live road checks & personnel reports |
| Output | Percentage (%) | Binary (Open/Closed/Delay) |
| Strengths | Early, consistent, data-driven | Ground-truth, nuanced, actionable |
| Critical Limitation | Can’t see “right now” on your street | Must wait until the last safe moment |
A classic example of prediction accuracy vs. official decision divergence happened recently in the Northeast. A storm was tracking to dump 10 inches of snow. Apps predicted a 99% closure rate. However, the storm sped up and ended by 2:00 AM. By 5:00 AM, road crews had cleared the main arteries.
The apps still said 99% because the historical data said 10 inches = Closed. But the superintendent, seeing dry pavement at 4:30 AM, made the call to open. The algorithm wasn’t wrong about the probability; the human was right about the reality.
How to Win Snow Day Season: A Strategic Guide for Families
You don’t have to pick a side. The smartest approach is to use both systems for what they are best at. Here is how to navigate the season using interpreting snow day odds alongside official alerts.
Days Before: Awareness
Use the predictor’s forecast for emotional and logistical awareness. If the app says 80%, that is your cue to text your backup babysitter or check your work-from-home policy. Use this time to buy groceries or find the snow boots. The predictor tells you if you need to worry.
The Night Before: Preparation
If the numbers are still high, prep as if school is closed. Pack the laptops, charge the iPads, and lay out warm clothes. But do not promise the kids a snow day yet. Frame it as a maybe.
The Morning Of: Action
On the morning of the storm, ignore the predictor. At this point, the probability doesn’t matter. Only trust the superintendent’s call. Set up push notifications from your district’s official app or Twitter account. Do not rely on third-party aggregator sites, which might experience data lag in school closures.
The Mental Model: The predictor is your weather radar; the superintendent is the pilot. The radar tells you it might be bumpy; the pilot decides if the plane takes off.
Embracing the Two-System Reality
The tension between the algorithm and the administrator isn’t a bug in the system; it is a feature of modern life. We have access to more data than ever before, but we still live in a physical world governed by human judgment and safety concerns.
By mastering the difference between the predictor’s forecast and the superintendent’s call, you stop being a passive victim of the refresh button. You’re no longer just waiting. You’re interpreting. You can use the data to prepare for the official call to act, turning the chaos of a winter morning into a manageable plan.
Your Snow Day Questions, Answered
Which is more accurate, the predictor or the official announcement?
In terms of outcome, the official announcement is the only one that is 100% accurate because it creates the reality. The predictor is accurate regarding probability based on past data, but it cannot create the final decision.
Why did the superintendent call a delay when the predictor said 95% closure?
This usually happens when precipitation stops earlier than expected, or temperatures rise slightly above freezing. Superintendents prefer to open schools if possible to preserve educational days and avoid extending the school year into summer.
Can a predictor get a district ‘wrong’ but still be correct?
Yes. If an app predicts a 90% chance of closure, it is saying that in 9 out of 10 similar scenarios, school was closed. If your day happens to be the 1 out of 10 that stays open, the probability was still mathematically sound, even if the result was disappointing.
How can I get the official call fastest?
Sign up for direct text alerts from your district. Check the official district website or verified social media accounts. Avoid relying on television scrolls or third-party websites, which may be delayed by several minutes.